I’ve been interested in astronomy and space since I was a kid, but never really did much with it. During my internship at Georgia Tech Research Institute, I learned to use a software-defined radio to investigate vulnerabilities in an IOT camera’s over-the-air communication protocol. Reading this post on using an SDR to detect pulsars inspired me. What else could you detect with one? Being interested in both astronomy and SDRs, this project naturally followed.
I can use a cheap (< $250) SDR backyard setup to observe the 21cm hydrogen line and probe the structure of our galaxy! One of the best parts of radio astronomy is that you can do it during the day! It can be a little more convenient to observe while the sun is up, and for our case specifically, the Milky Way is overhead for a decent chunk of the day.
Background
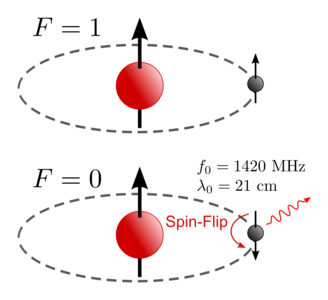
How the spin-flip transition works
The hydrogen line is a spectral line given off by neutral hydrogen in space. It’s important for our understanding of the universe because it can penetrate through dust clouds and allows us to probe regions that are blocked to visible light. It’s been used to calculate the rotation curve of our galaxy, made an appearance on the Pioneer plaque and is an important frequency for radio astronomy.
Hydrogen is the most abundant element in the universe, and the Milky Way is no exception. Most of this hydrogen is in a neutral state. This neutral hydrogen can change energy states from higher to lower, giving off the 21cm Hydrogen line. A Hydrogen atom has two possible spin configurations; the first is a slightly higher energy state where the proton and electron have the same spin, with the magnetic field of the electron reversed. In the second, the particles have the opposite spin with the same magnetic field. Given enough time, a Hydrogen atom in the first state will spontaneously flip its spin orientation to the second state. The energy difference between the two is given off by a photon with a wavelength of 21cm– the Hydrogen line. The equation that governs this is below:
\[ \lambda = \frac{1}{v} \dot \, c = \frac{h}{E} \, \dot \, c \approx \frac{4.135 \, \dot \, 10^{-15} eV \, s}{5.874 \, \dot \, 10^{-6} eV} \, \dot \, 2.997 \, \dot \, 10^{8} \, m \, s^{-1} \approx 0.21106 \, m = 21.106 \, cm \]
While the spin-flip transition is rare (taking ~10 million years to occur for a single atom), there is a lot of hydrogen in space. Hydrogen is concentrated in the spiral arms of the Milky Way and especially in the galactic center (near Sagittarius). The Hydrogen line is very narrow, centered on 1420.405 Mhz. Using this knowledge, I can image different arms of the Milky Way and observe the delta between the observed and expected frequency. This can be used to calculate the radial speed of the different arms of the galaxy!
Setup
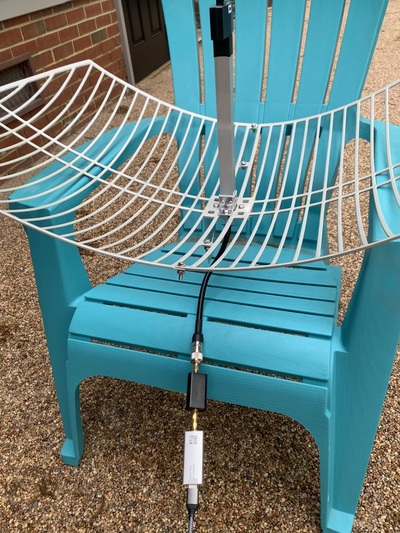
I followed this guide from RTL-SDR.com to set up my equipment. I used a 1-meter parabolic dish, Sawbird H1 low noise amplifier (LNA), 50Ω terminator, and an RTL-SDR. The total cost for the equipment came to just over $200, not including the RTL-SDR and raspberry pi I already owned.
I connected my RTL-SDR to the LNA directly and connected the LNA to the parabolic dish. The SDR was then connected to my raspberry pi using a USB->USB cable.
Software
I used Virgo, a versatile spectrometer for radio astronomy, to process my raw data. It bundles together some tools to plan observations, use calibration data, filter out RFI, and create some pretty plots.
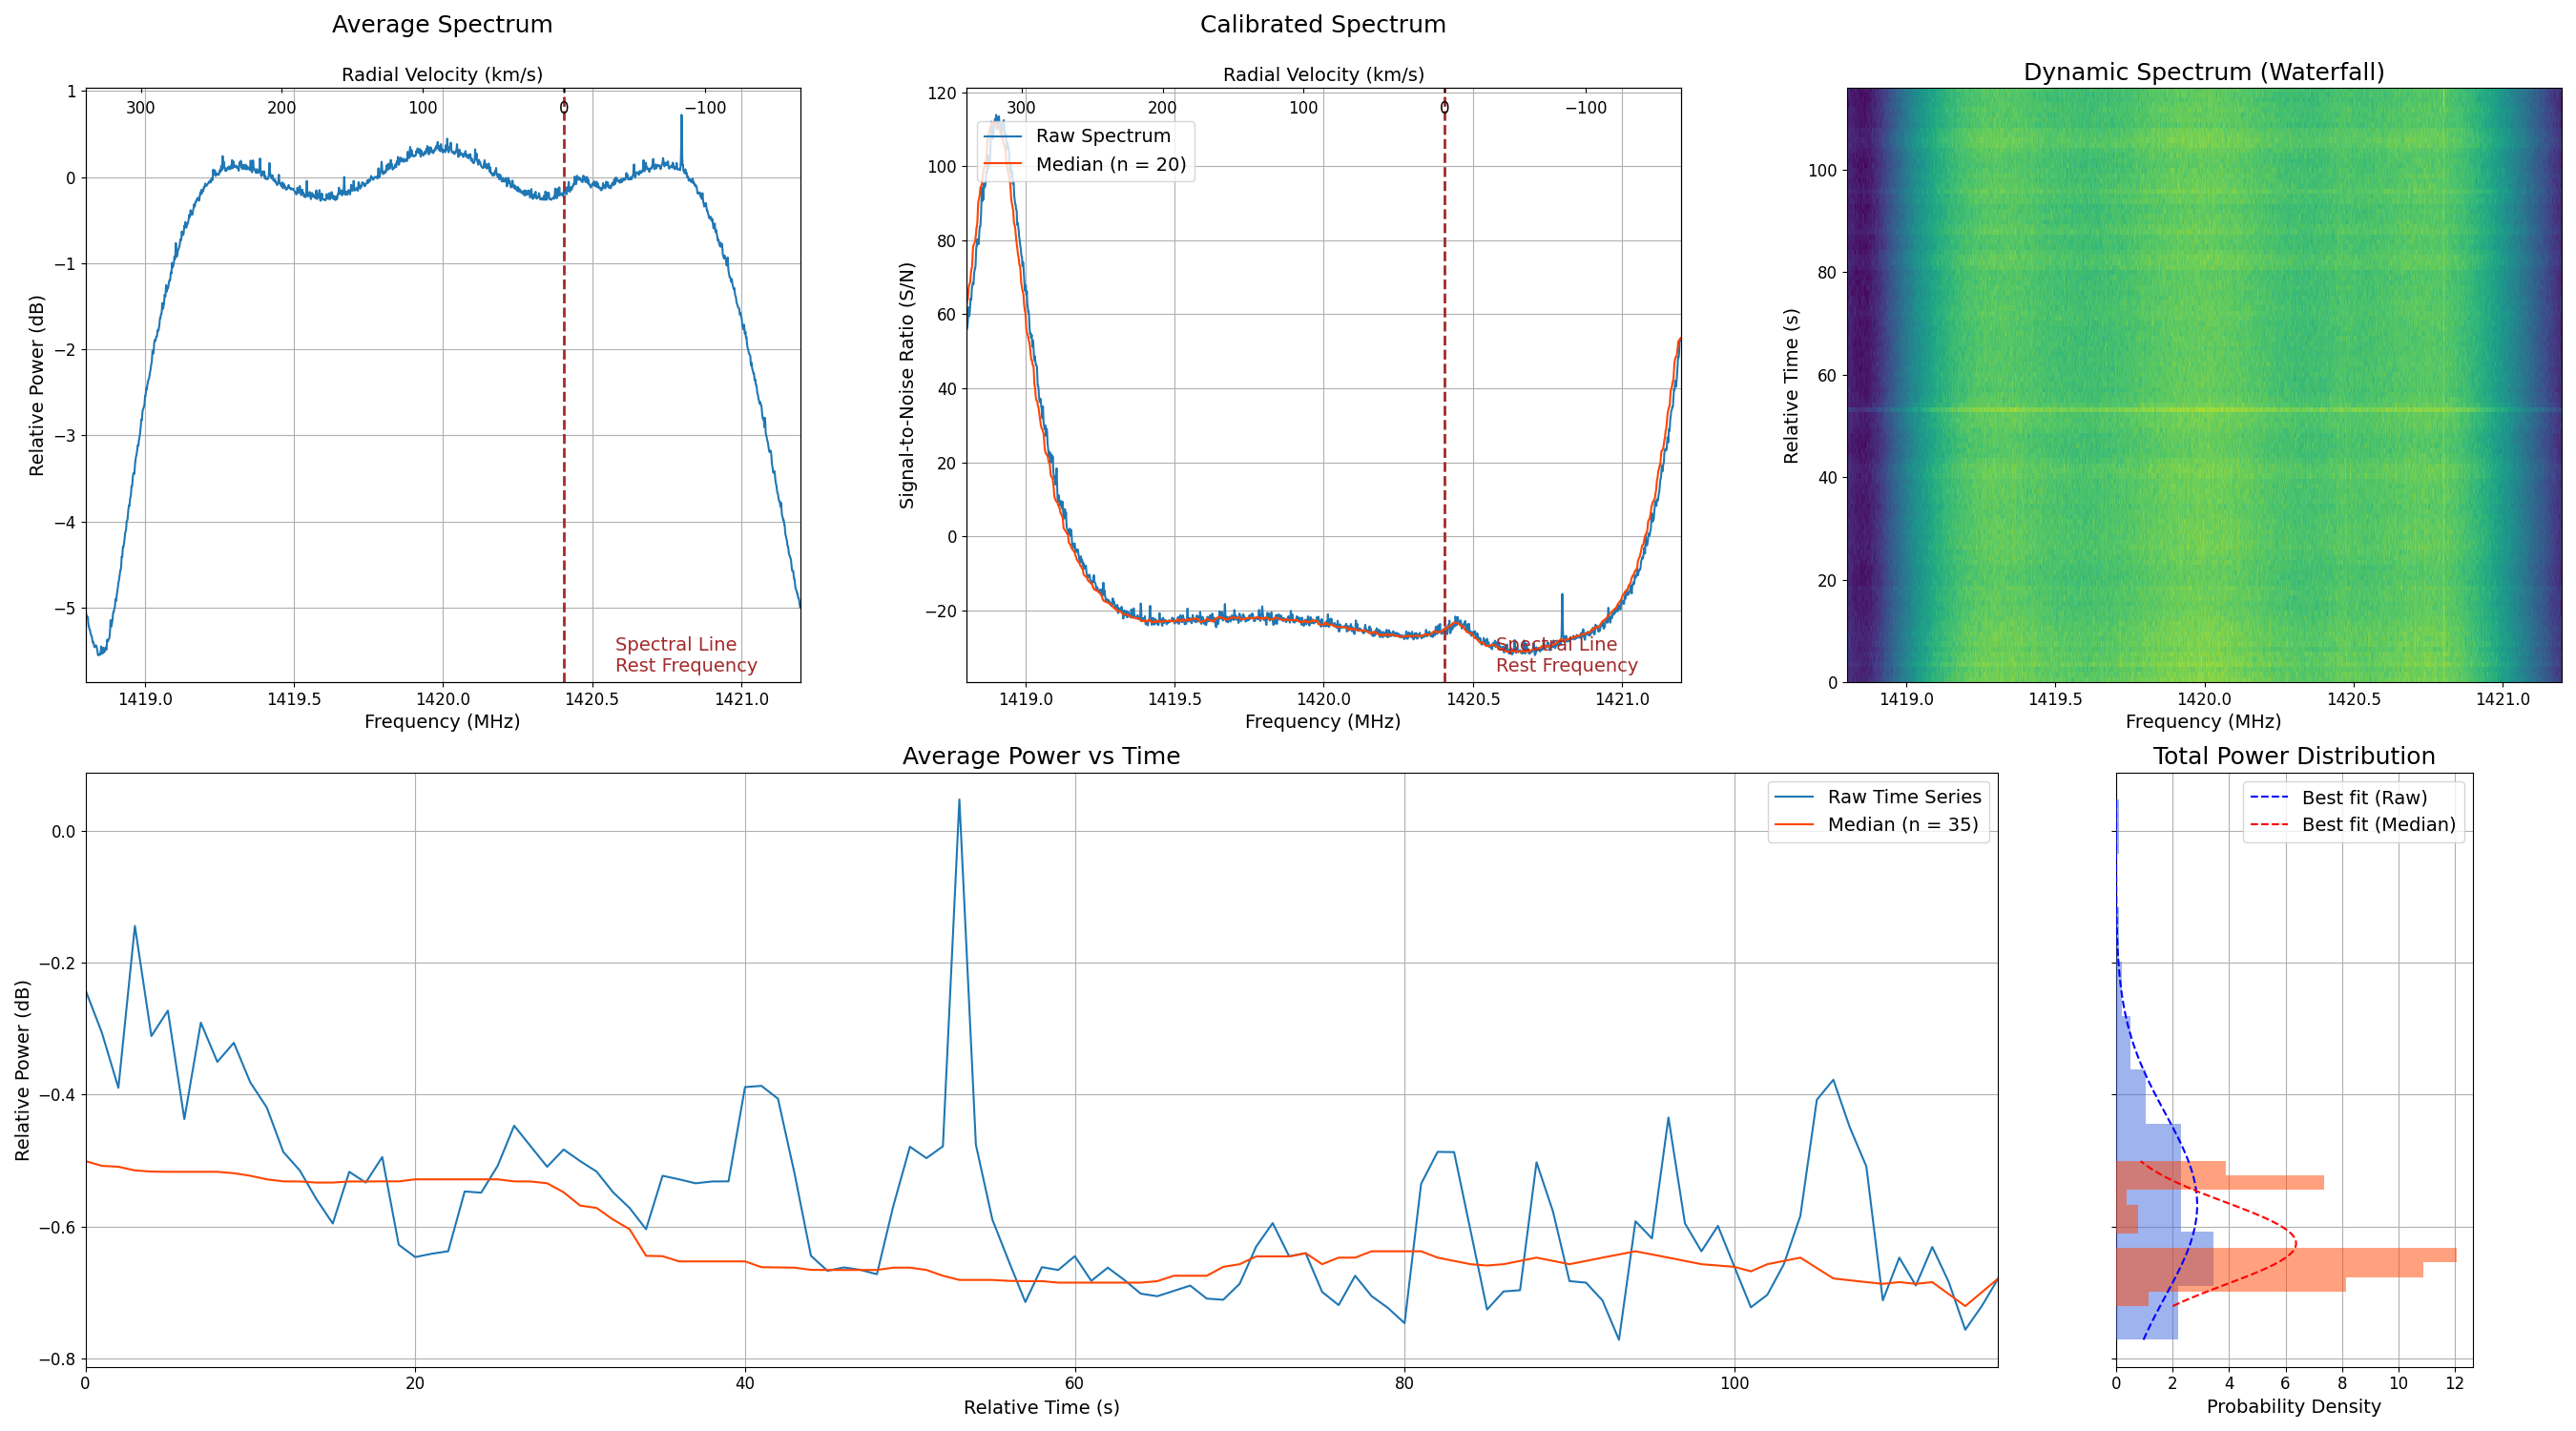
Below is a short, 2-minute exposure I took. You’ll notice the calibrated spectrum looks very different from the average spectrum. The three large peaks in the average spectrum are an artifact of the low-noise amplifier’s bandpass filter. In the calibrated spectrum, the small peak just to the right of the hydrogen line is the emission given off by the Milky Way! The sharp line to the right is some interference.
Doppler Shifts
I can calculate the radial velocity of the observed target using the doppler method!
\[ \frac{\Delta \lambda}{\lambda} = \frac{v}{c} \]
I don’t have quite the amount of data I’d like to calculate doppler shifts for all arms of the Milky Way, but rest assured this method does work! PhysicsOpenLab has a great article on this.
While I made my first batch of observations manually, it’d be ideal to automate them so I can have the observatory run continuously! However, there isn’t always a suitable target overhead to observe. I need some way to determine whether or not I should make an observation!
Automating the Observatory
I’d like to automatically make observations when some portion of the Milky Way is overhead. Luckily, Virgo provides some handy tools to let us do this.
First, I need to get the right ascension and declination to figure out where in the sky our radio telescope is pointing. To make things simple, I can assume the telescope is pointing straight upwards.
altitude = 90
azimuth = 0
ra, dec = virgo.equatorial(altitude,azimuth,latitude,longitude)
Once I know where in the sky the telescope is looking, I want to translate this to where it’s looking relative to the galactic plane.
_ , latitude = virgo.galactic(coords[0],coords[1])
Because the telescope is pointing straight up, I’m only concerned with the latitude. It has a beamwidth of approximately 8 degrees so I want to observe if:
latitude > -8/2 and latitude < 8/2
This only takes into account the center of the galactic coordinates, the Milky Way has an apparent width of around ~30 degrees. I can adjust the observation condition to:
latitude >= -30/2 and latitude <= 30/2
Putting it all together, this is the script I used to automate my observatory.
import virgo
from datetime import datetime
from subprocess import Popen
import sys

try:
    latitude = longitude = 0 # your lat/long
    coords = virgo.equatorial(90,0,latitude,longitude)
    coords = virgo.galactic(coords[0],coords[1])
    lat = coords[1]
    if lat >= -30 and lat <= 30:
        prefix = './Observations/' + datetime.today().strftime('%Y-%m-%d-%H-%M')  + '/'
        print(prefix)
        cmd = 'mkdir -p ' + prefix
        p = Popen(cmd, shell=True)

        obs = {
            'dev_args': 'rtl,bias=1',
            'rf_gain': 30,
            'if_gain': 25,
            'bb_gain': 18,
            'frequency': 1420e6,
            'bandwidth': 2.4e6,
            'channels': 2048,
            't_sample': 1,
            'duration': 60
        }

        # Calibrate the data
        print("Calibrating the dish, duration: " + str(obs['duration']) + ' seconds' )
        timestamp = datetime.today().strftime('%Y-%m-%d-%H-%M-%S')
        cal_file_name = str(prefix + 'cal-' + timestamp + '.dat')
        print("Saving in file: " + cal_file_name)
        print('')

        virgo.observe(obs_parameters=obs, obs_file=cal_file_name)
        print('')
        input("Move the satellite dish to the Galactic Plane")
        print('')
        # Observe
        obs['duration'] = 600*3 # time in seconds
        print("Starting observation, duration: " + str(obs['duration']) + ' seconds')
        timestamp = datetime.today().strftime('%Y-%m-%d-%H-%M-%S')
        obs_file_name = str(prefix+ 'observe-' + timestamp + '.dat')
        print("Saving in file: " + obs_file_name)
        print('')

        print("Observing")
        virgo.observe(obs_parameters=obs, obs_file=obs_file_name)
        cal_file_name = "cal.dat"
        virgo.plot(obs_parameters=obs, n=20, m=35, f_rest=1420.4057517667e6,
                obs_file=obs_file_name, cal_file=cal_file_name,
                dB=True,  plot_file=prefix+'plot.png')
except Exception as e:
    print(e)
finally:
    pass
    # needed on windows to disable bias tee on the RTL-SDR
    # p = Popen('bias_tee_off.bat', cwd=r'./',shell=True)
    # stdout, stderr = p.communicate()
Run it every 5 minutes with cron and you have an automated backyard radio observatory!
crontab -e
*/5 * * * * ~/radio_astro/observe.py
Wrapping Up
I had a blast working on this project! It’s amazing that with $200 in equipment, you can put together an observatory to detect the different arms of the Milky Way!
On my list of future upgrades is a nicer SDR, specifically the USRP B200. I got to use one while working at GTRI and really enjoyed working with them. I’d also like to upgrade the post-observation portion of the observatory, automatically syncing data to the cloud and maybe even publishing live to a website.